inflation

Consumer Price Index increases 0.9% in October for the second time in 2021.
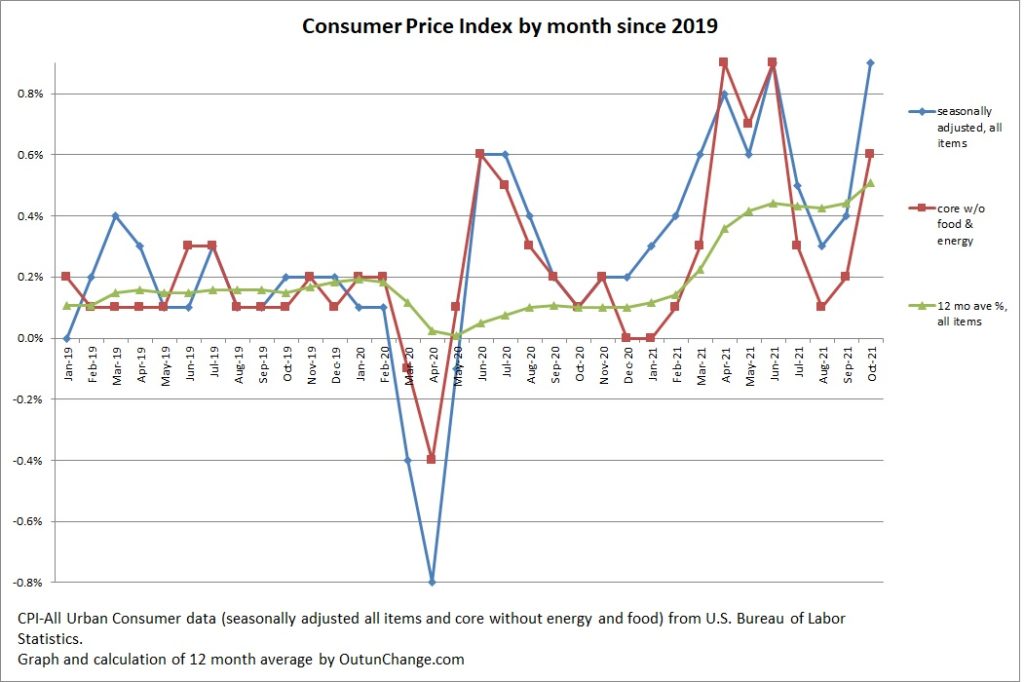
The Consumer Price Index (CPI) increased 0.9% in October 2021 after a more modest 0.4% increase in September and 0.2% in August.

The October increase matches the June increase of 0.9% and is slightly higher than April increase of 0.8%.

Diving into the components of the CPI shows the increases are broader than several months ago.

The press release from the Bureau of Labor Statistics explains:

“The monthly all items seasonally adjusted increase was broad-based, with increases in the indexes for energy, shelter, food, used cars and trucks, and new vehicles among the larger contributors. The energy index rose 4.8 percent over the month, as the gasoline index increased 6.1 percent and the other major energy component indexes also rose. The food index increased 0.9 percent as the index for food at home rose 1.0 percent. “

Warning sign as we roll into winter is fuel oil increased 12.3% in October and utility gas increased 6.6%. Keep in mind those are changes for the month, not for the year.

Consumer Price Index increases 0.9% in October for the second time in 2021. Read More »
Producer Price Index in October 2021 shows continuing inflation.

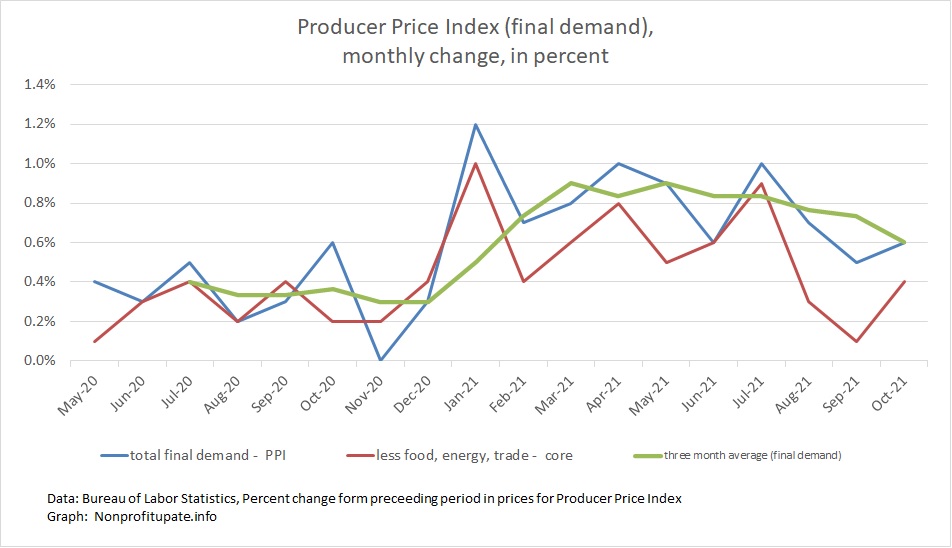
The Producer Price Index (PPI) in October 2021 continues to show unusually high and ongoing inflation. Increasing October was 0.6%, which follows a 0.5% increase in September and 0.7% increase in August.

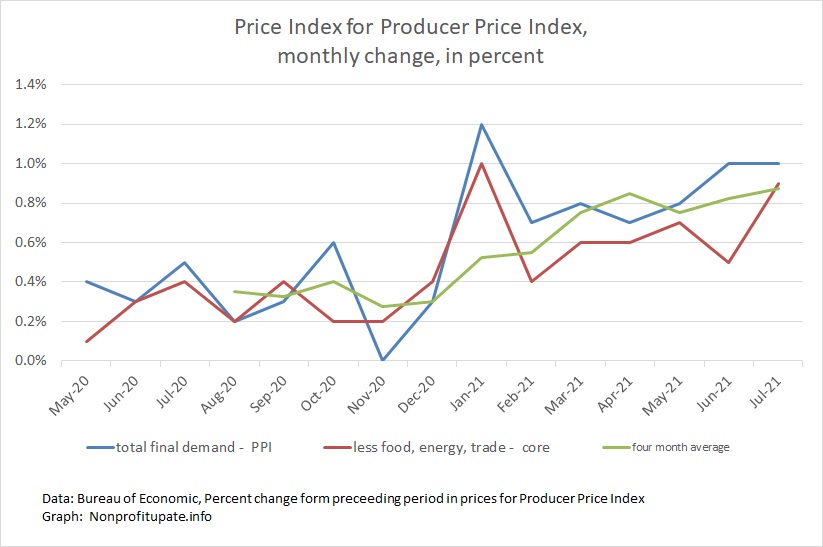
The PPI has shown high inflation for all of 2021. The worst months were 1.2% in January, 1.0% in April, and 1.0% in July. Those extremes have not repeated for the last quarter, which is a small amount of good news.

Graph at the top of this post shows the monthly change and final demand (the total index in other words) in blue. The average of the monthly changes in green. The red line shows core change, which excludes food, energy, and trade.

The PPI was increasing around 0.4% the month until the end of 2020. Since then it has averaged 0.8% for 2021 through October. Ouch.

This index is explained by the Bureau of Labor Statistics as follows:

Producer Price Index in October 2021 shows continuing inflation. Read More »

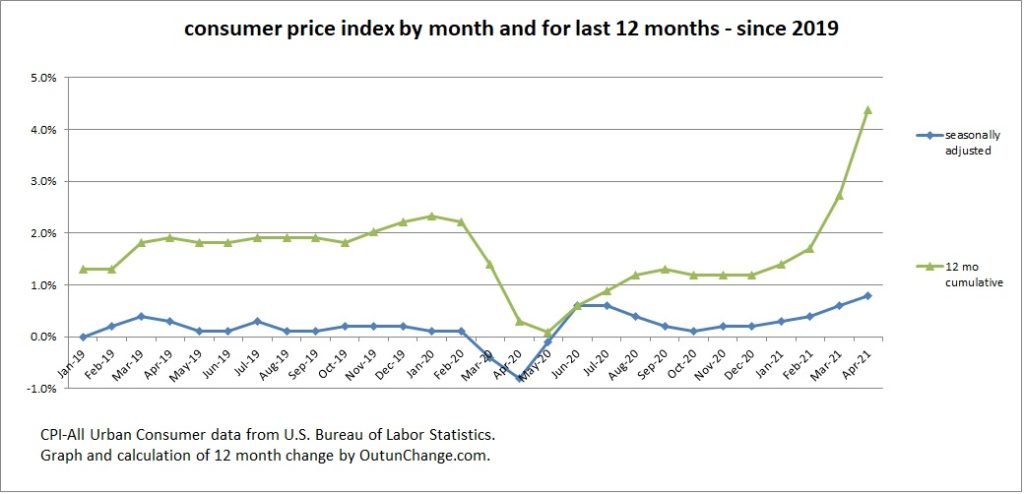
Consumer Price Index increase for September 2021 continues strong, with 12 month inflation running at worst rate since 1990.

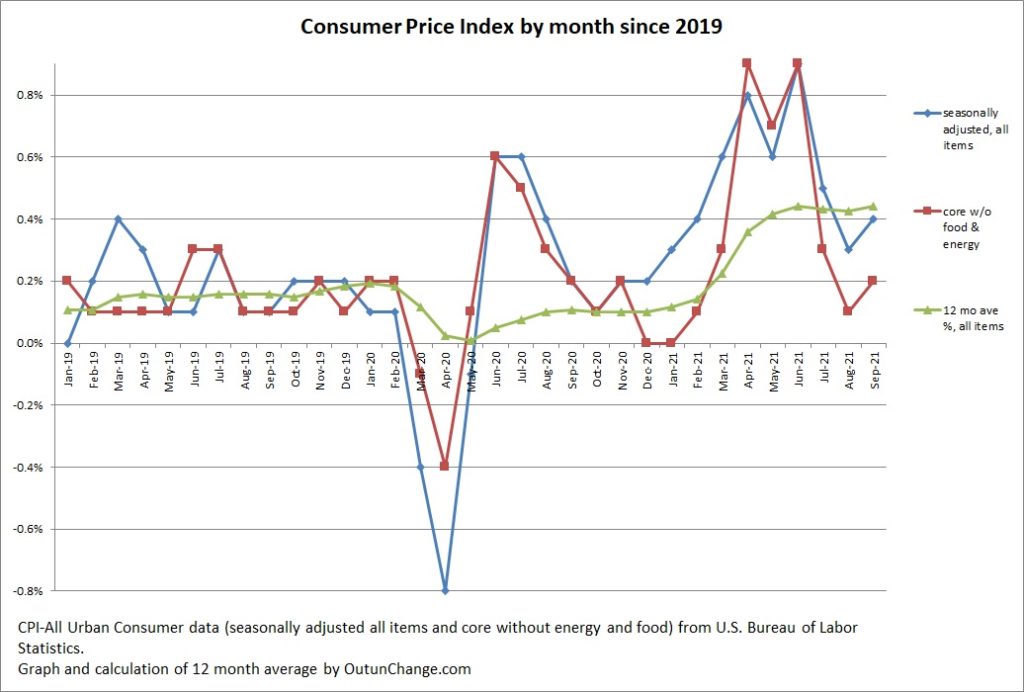
The Consumer Price Index, or CPI, shows a 0.4% increase in September 2021 for all-items with a core increase of 0.2%.

The rate of inflation for the last 12 months is 5.43% for all items and 3.86% for core inflation without food and energy.

Graph at top of this post shows the monthly increase in the all-items index along with the core change. Graph also shows an average of the preceding 12 months for all items.

Watch the green line increase from around 0.1% up to over 0.4% for the last five months.

The trailing 12 month average is also grim. It shows:

Consumer Price Index increase for September 2021 continues strong, with 12 month inflation running at worst rate since 1990. Read More »

What’s likely to happen with inflation? More of it and for extended time.

Rising costs and constrained shipping capacity is driving inflation and disrupting supply chain across the economy. Image courtesy of Adobe Stock.

Indicators I can see suggest inflation is going to continue at a high rate for quite some time. Here are a few of the articles I have read recently pointing towards ongoing rise in prices:

  • Rent component of CPI will increase substantially over the next year because of the way the index is calculated.
  • Shipping costs have already skyrocketed.
  • Multiple food producers are struggling with rapidly increasing costs.
  • Major food producer expects their costs go up 11% in the next year with prices they charge to go up by 4%.
  • The phrase “stagflation” is back in play. Oh joy, a possible (likely?) return to the Carter administration.

Asia Times – 8/27/21 – US rent hikes will explode consumer inflation in 2022 – Anecdotal information indicates rental prices are skyrocketing.

A friend of mine priced the apartment they are living in to help a relative who was moving into the area. Price for this exact unit is 50% more than when they signed their annual lease a number of months ago.

An acquaintance reports the price for renting a particular house went up while they were thinking about it for a day or so.

Two friends report landlords renting apartments expect six months rent in advance and some landlords renting houses are expecting a year in advance. A year.

Article mentioned above says the reports floating around in the media indicate rent hikes overall are around 10%. Yet the CPI shows only 2% increase in rent.

How can that be?

Fascinating detail of how the CPI is calculated explains the anomaly and also points towards dramatic increase in the rent component of CPI over the next year.

What’s likely to happen with inflation? More of it and for extended time. Read More »

Consumer Price Index again showing strong inflation in July 2021.

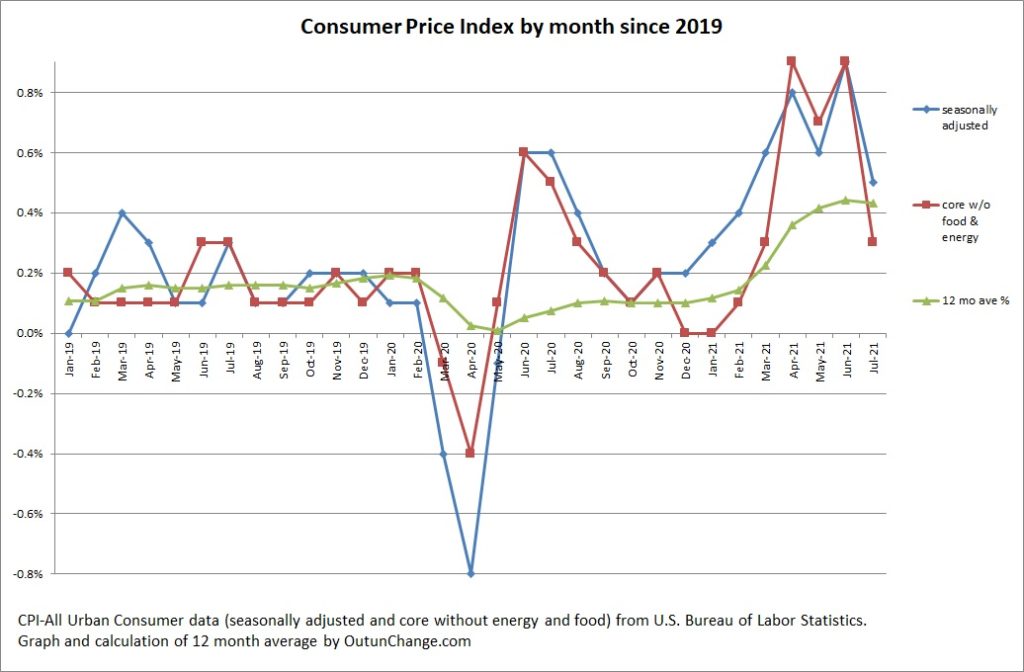
The Consumer Price Index, or CPI, shows 0.5% price increases in July with a core increase of 0.3%. While that is the lowest increase since February 2021, half a percent in one month works out to about 6% in a year.

Graph at top of this post shows the monthly change in the primary index along with the core change which excludes food and energy. Graph also shows an average of the preceding 12 months.

The average was running around 0.1% a month for most of 2020 after the shock of the pandemic. You can see the rising monthly increase quite visibly, starting in January 2021. Watch the green line increase from around 0.1% up to currently 0.4%.

The trailing 12 month average is also grim. It shows:

Consumer Price Index again showing strong inflation in July 2021. Read More »

Producer Price Index in July 2021 pointing toward increasing inflation.

Everyone is aware of the Consumer Price Index. Another less known indicator of price levels is the Producer Price Index, or PPI.

The PPI suggests prices have been shooting up since the January 2021.

This index is explained by the Bureau of Labor Statistics:

Producer Price Index in July 2021 pointing toward increasing inflation. Read More »

Accelerating inflation rate continues in May 2021.

Changes in the Consumer Price Index have been making a splash in the news lately. Increases over the last three months have been unusually high.

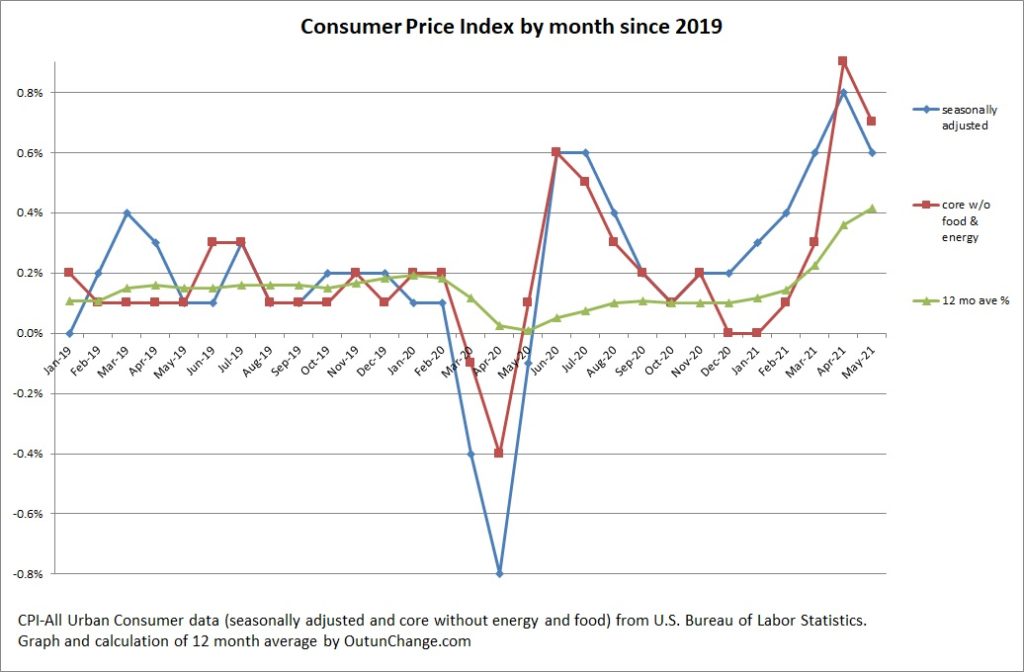
The headline consumer price indicator increased 0.6% in May after 0.8% in April and 0.6% in March. That is a big run of inflation for three months.

The core measure, which excludes energy and food costs, has been on a roughly parallel track with 0.7 increase in May following a 0.9% in April and 0.3% in March.

Graph at the top of this page shows the change in the primary inflation indicator, and the core index along with a 12 month average of the monthly change.

You can see a large drop in prices during the pandemic followed by spikes over the next several months. Price changes returned to normal range in the September 2020 through February 2021 timeframe.

What is behind those numbers? Let’s check out the Wall Street Journal’s narrative:

Accelerating inflation rate continues in May 2021. Read More »

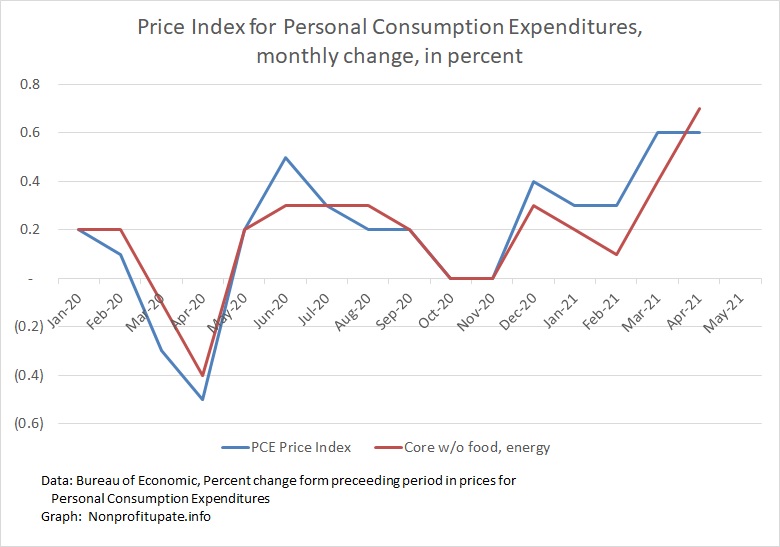
Monitoring inflation through the Personal Consumption Expenditure (PCE) price index.

Another way to keep track of inflation trends is by watching the price index for the Personal Consumption Expenditure.

Please journey along with me as I continue my education.

In the news yesterday was the April increase which showed a 3.1% year-over-year increase compared to an expectation of a 2.9% increase. For one article discussing the news, check out the following:

I have started to track this data, gathering information back to the start of 2020. The month by month change in the headline index and the core index (which excludes food and energy costs) can be seen in the graph at the top of this post.

Before look at the year-over-year change, we need to look at the nature of the index. There are two main indices used to monitor inflation. The first is the Consumer Price Index (CPI) which everyone knows about. The other is the Personal Consumption Expenditures (PCE).

What’s the difference? Great question.

Monitoring inflation through the Personal Consumption Expenditure (PCE) price index. Read More »

It’s time to start monitoring inflation.

As CPAs, we pay attention to economic trends because those have big impact on our client’s operations.  Understanding what is happening in terms of interest rates, growth or shrinkage in the GDP, unemployment trends, and real estate prices also helps us interpret financial statements during and audit or review.

It is time to start monitoring inflation rates.

Graph at the top of this post shows worrying information about inflation.

It’s time to start monitoring inflation. Read More »