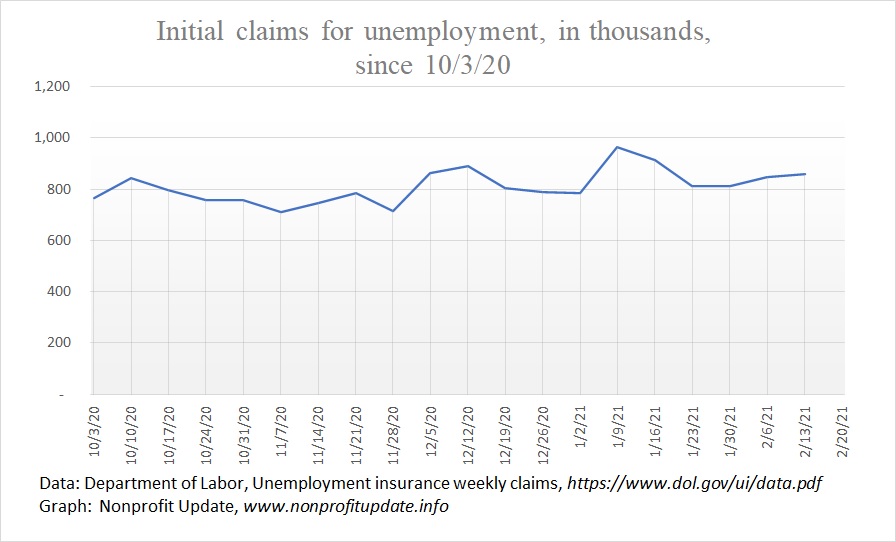
The number of new claims for unemployment for week ending 2/13/21 increased 13,000 after 36,000 increase the prior week. (Previous week numbers were revised upward by 55,000.)
This follows a two-week decline of 153K (1/16 and 1/23). Prior week of 1/9 saw a 181K increase.
New claims in state programs for the last three weeks:
- 812K – 1/30/21
- 828K – 2/6/21
- 861K – 2/13/21
Since 8/29/20, the new weekly claims ranged from a low of 711K to high of 965K. average since then is 824K.
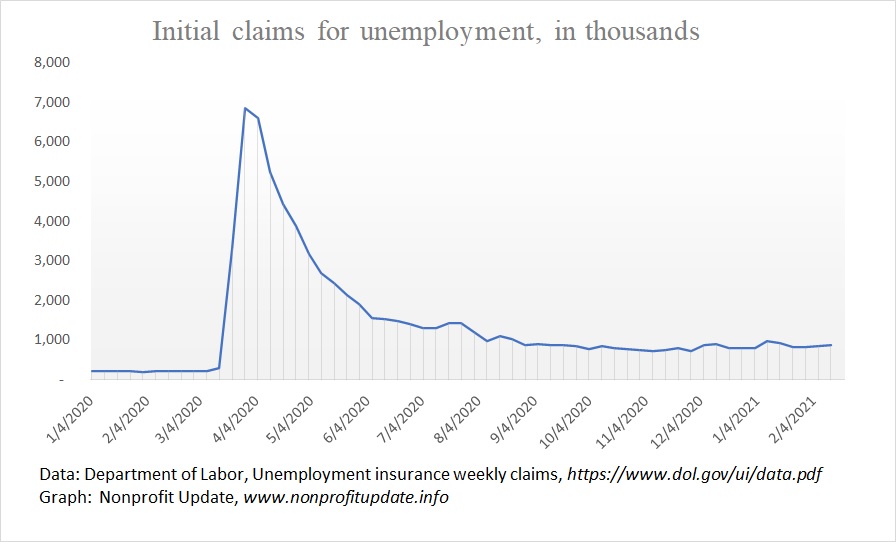
For context consider before the economic shutdown the new claims averaged about 220K per week. For the last 25 weeks (about half a year) we are now running about four times the previous norm.
News report
Article at Wall Street Journal on 2/18/21 reports U.S. Unemployment Claims Rise, Pausing Recent Downward Trend. Article indicates consensus of a survey by the paper was the new claims would drop to 773K, which is in stark contrast to actual claims rising to 861K (preliminary).
The new claim data suggests the economy is slowing down. Some other indicators, such as retail sales rising in January, are suggesting the economy is improving..
Following graphs show the devastation from the economic shutdown.
New claims
New claims for unemployment by week since the start of 2020:
Top of this post shows a graph looking closer at the new claims since 9/5/20.
Continuing claims
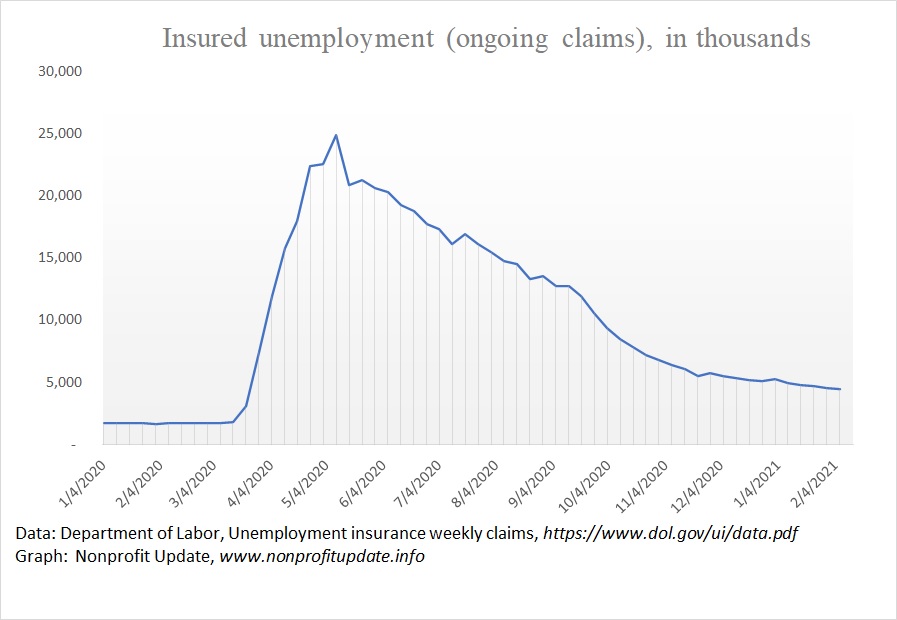
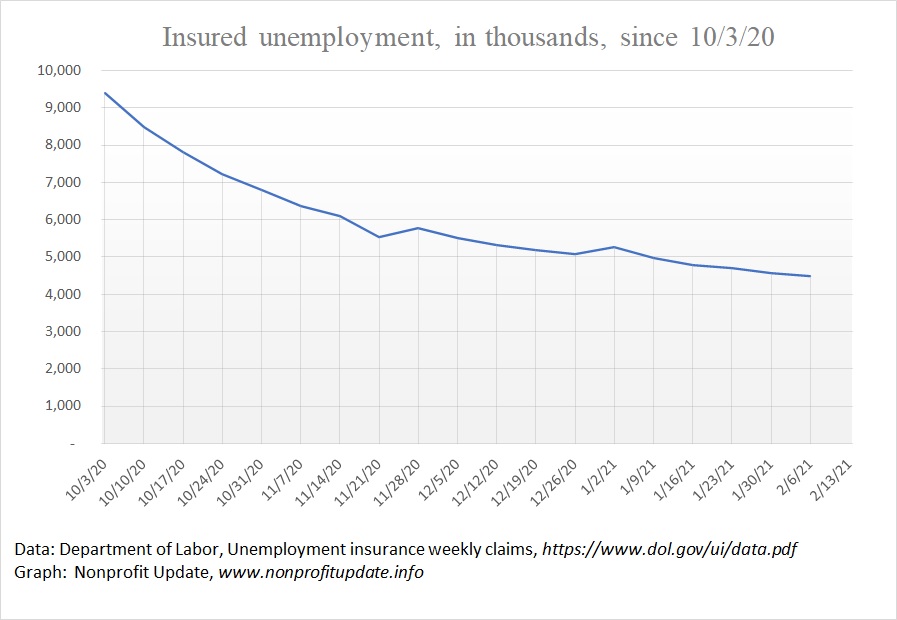
The number of people covered by unemployment insurance who are drawing checks is extremely high, but is continuing to drop, even if slowly. This is labeled as the number of insured unemployed. People going into the extended benefits program at the federal level offset a large portion of the drop.
Continuing claims since start of 2020:
A closer look at the continuing claims at the state level only since 10/3/20:
Continuing claims in state and federal programs
When people exhaust the state level coverage, they become eligible for the extended federal benefits, called the Pandemic Emergency Unemployment Compensation program.
Tally of people who are now in the extended 13 weeks covered at the federal level is offsetting a portion of the drop in state-level. The number of total covered unemployed is dropping only slowly. Here is a recap of the change in state and federal unemployment claims calculated in three week increments:
- (0.57M) – 10/3/20, 2 week change
- (1.98M) – 10/24/20, 3 week change
- (0.52M) – 11/14/20, 3 week change
- (0.21M) – 12/5/20, 3 week change
- (0.74M) – 12/26/20, 3 week change
- (0.72M) – 1/16/21, three week change
- 0.27M – 1/30/21, two week change, which is first total increase
Graph of state coverage and extended federal coverage:
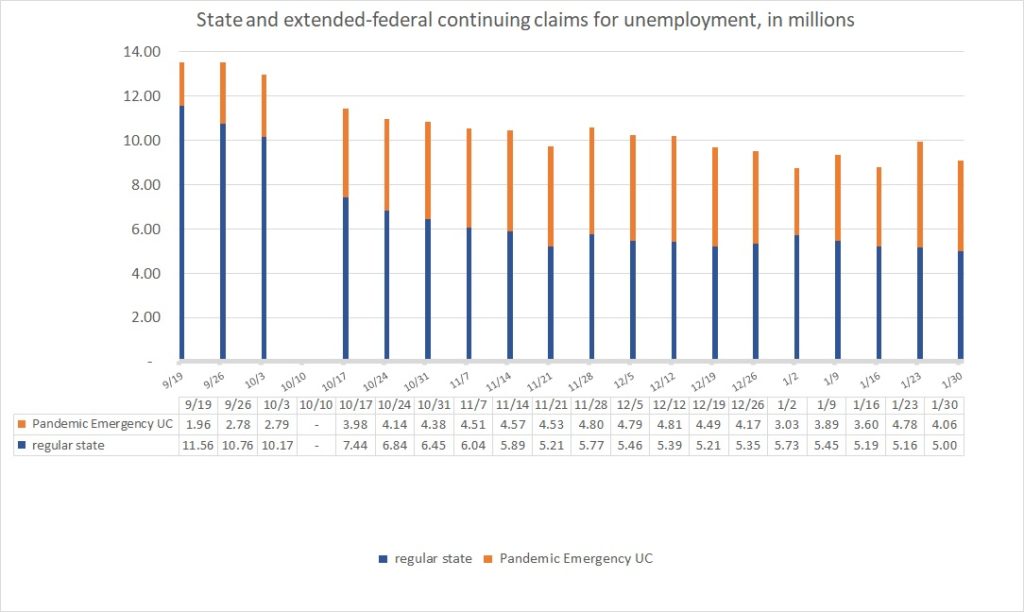
The combined total of people receiving state or federal unemployment is declining very slowly. That suggests the recovery is quite slow.