More explanation why the entire supply chain system is overloaded.

The supply chain is complicated. There is no switch you can throw to magically make all those connections smoothly work together again. Image courtesy of Adobe Stock.

The supply chain for everything is tangle up to the extent it will take lots of time to function normally again.

Two articles describing the depth of issues:

  • Analogy of turning off a complex computer system. Some of the hundreds of components won’t work when you throw the ‘on’ switch.
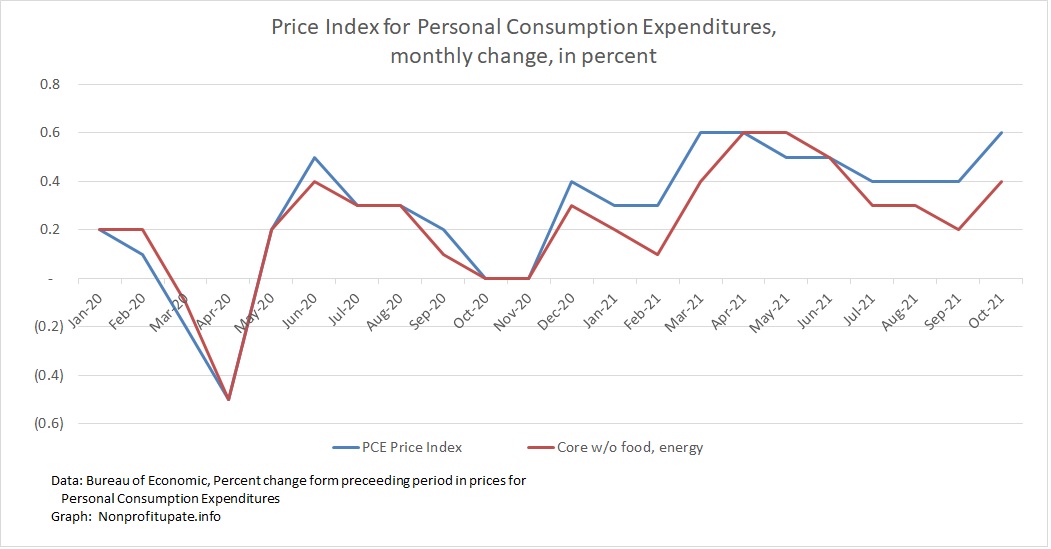
  • Description of the demand side pressure on supply chain. All those trillions of federal dollars sloshing around have created demand which has overloaded distribution systems.

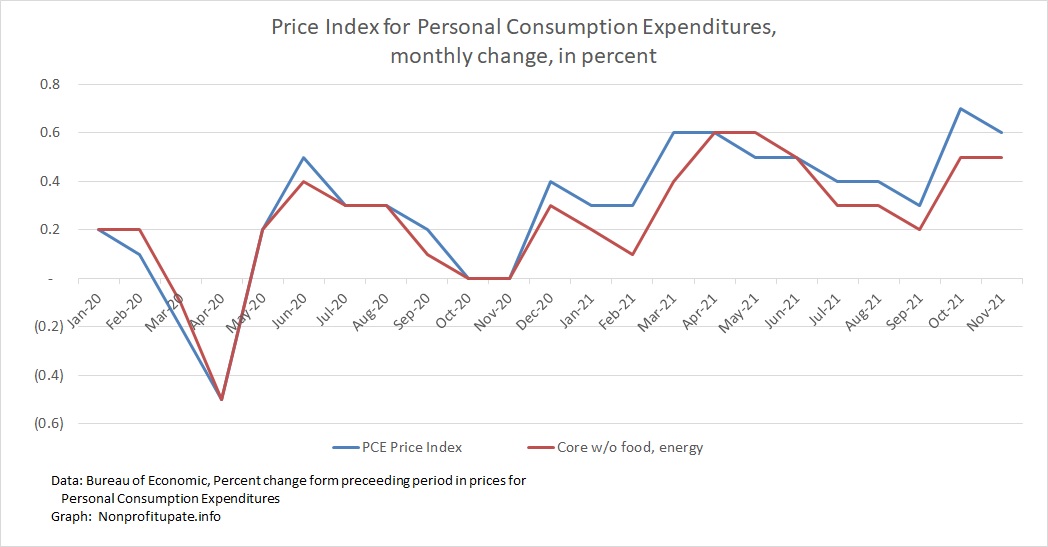
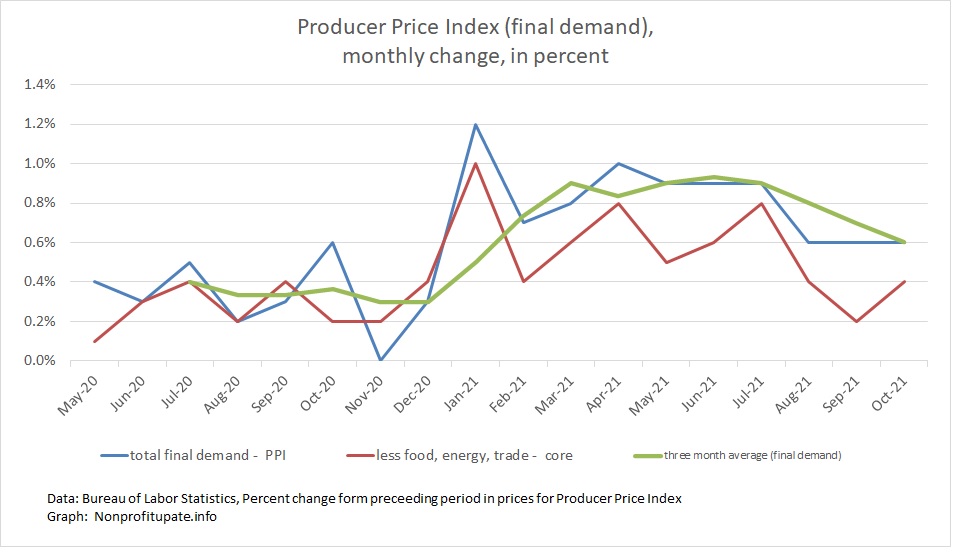
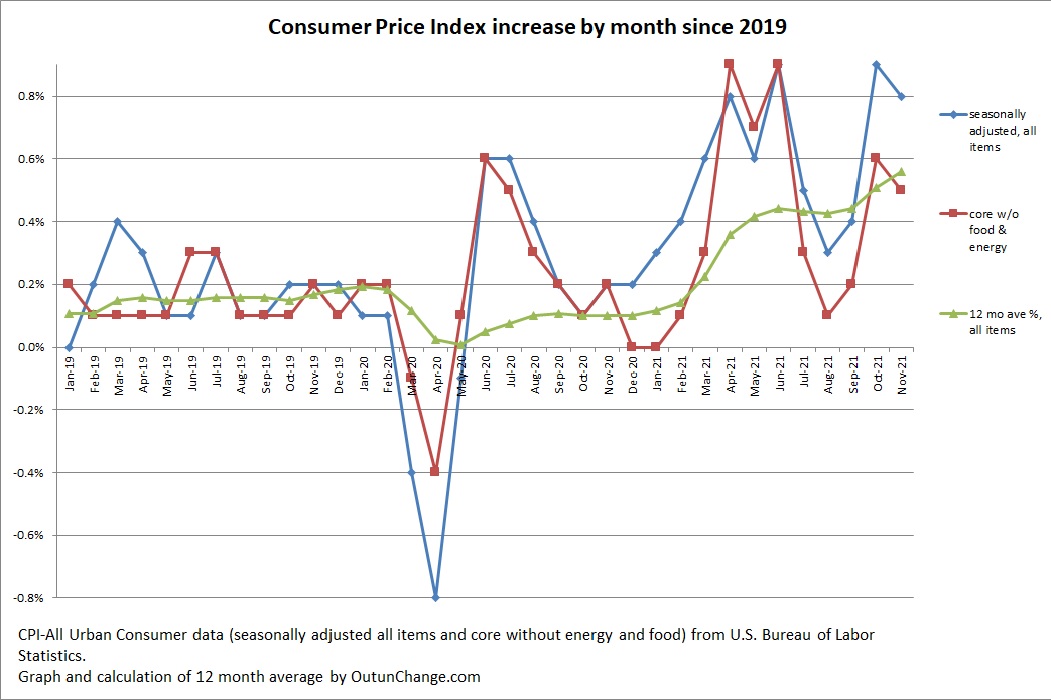
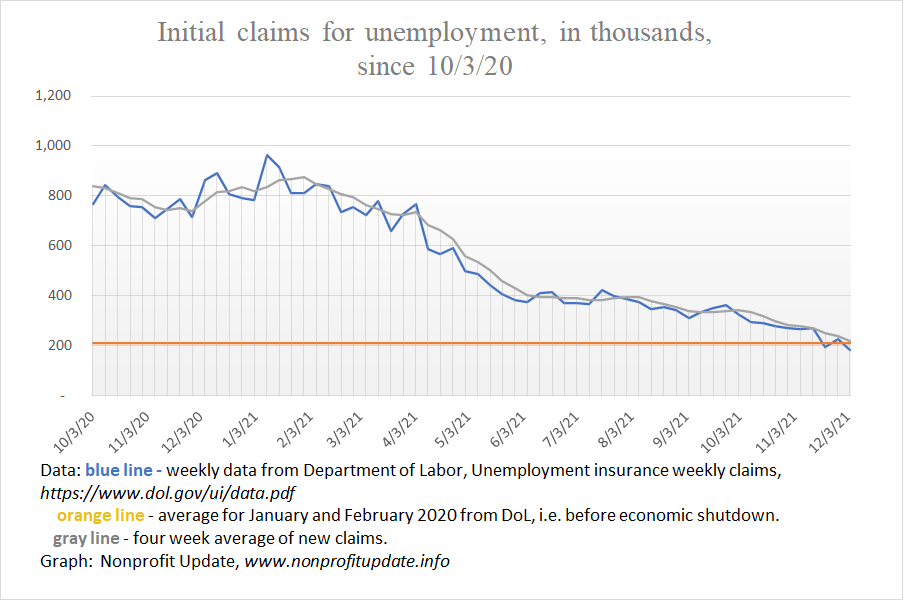
(Cross posted from my other blog, Nonprofit Update, because it will be helpful to understand broad supply chain issues for audits during the upcoming busy season.)

American Thinker – 12/11/21 – We broke everything in the name of Covid – Author ran a large IT department at one point in the past. Every few years they had to shut down the entire computer system so that the factory could go through maintenance of the electrical system.

Two former KPMG partners involved in PCAOB inspection leak fiasco surrender their CPA licenses.

Image courtesy of Adobe Stock.

There’s an old saying that the wheels of justice grind slowly, but they grind very fine. In the accounting world the wheels of justice don’t even start to turn until the criminal justice wheels have ground everyone into powder.

Effective this past August and November two of the key former partners from KPMG involved in the PCAOB inspection cheating scandal surrendered their licenses.

Personal Consumption Expenditure index for November 2021 shows continuing high inflation.

The Personal Consumption Expenditure (PCE) inflation index increased 0.6% in November.  This after the 0.6% in October 2021 increase was revised upward from 0.6% to 0.7%.

The core PCE inflation rate (without food and energy) was 0.5% in November and 0.4% in October.

This indicates inflation is continuing. When you look at all of 2021 perhaps inflation is accelerating.

Disciplinary actions from California Board of Accountancy – Fall 2021

Image courtesy of Adobe Stock.

The California Board of Accountancy Update newsletter, issue #94 dated Fall 2021, has details of disciplinary actions with effective dates in summer and fall of 2021.

A simple lesson for all CPAs from these situations is just do your job with at least a bare minimum of competence. The firms below didn’t get in trouble because they missed some SASs or were oblivious to some new or big or recent ASU. They didn’t get in trouble because a client lost out on a contested tax position. They didn’t get in trouble because they fell a few hours short on CPE or miscounted A&A hours.

No, they had splendiferous belly-flops from the 50 meter high dive. Examples?

Federal mileage rates for 2022.

Image courtesy of Adobe Stock.

The IRS has published the reference amounts for mileage rates for 2022. The rates:

Beginning on January 1, 2022, the standard mileage rates for the use of a vehicle will be:

  • 58.5 cents per mile driven for business use, up 2.5 cents from the rate for 2021,
  • 18 cents per mile driven for medical or moving purposes, up 2 cents from the rate for 2021, and
  • 14 cents per mile driven in service of charitable organizations.

The standard rate for business is based on their analysis of the fixed and variable costs of operating a vehicle.  The medical & moving rate is based on variable costs of operation.

Rates were published in Notice 2022-03  2022 Standard Mileage Rates.

Producer Price Index increases 0.8% in November 2021.

The Producer Price Index (PPI) in November 2021 shows inflation is running hot with 0.8% increase for the month.

This follows revised 0.6% for each of the three previous months (August, September, October).

I suppose this four-month run can be considered an improvement over the previous four months which were 1% in April and 0.9% in each month of May, June, and July.

That is an average of 6.5% for the last four months, down from an average of 9.25% for the preceding four months. The average monthly increase in the PPI for 2021 is a whopping 0.82%. Per month.

Graph at the top of this post shows the monthly change in final demand (the headline number) in blue. The average of the change for the latest three months is in green. The red line shows core change, which excludes food, energy, and trade.

The PPI calculation has many subcomponents, just like the CPI and PCE. Let’s look at the breakout between producer price increases for final goods and increases for final services. Following graph shows Total final demand, Final demand goods, and Final demand services. In other words the total price run up with a breakout between goods and services:

Inflation is going to continue at high rate, if not accelerate.

Illustration of what 5% inflation does in one year. Image courtesy of Adobe Stock.

Variety of articles are pointing towards higher inflation on the horizon. An increasing number of articles I’ve seen point towards inflationary expectations getting built into thought process of consumers and companies.

Articles for your consideration:

  • Kraft Heinz product line will see an average of 5% increase at the start of 2022.
  • Many companies are planning large raises in 2022, averaging 3.8% in one survey.
  • Background article by AP speculates high inflation will continue well into 2023. Other articles are providing similar speculation.

Post-Millennial – 11/9/21 – Kraft Heinz to raise prices of products up to 20% – Average price increases by Kraft Heinz for the entire product line will average 5% starting 1/9/22. Specific product lines will see dramatic increases, such as 16% for Jello and puddings, 10% for Bagel Bites, with the headliner of 20% being Mac & Cheese.

Consumer Price Index increases 0.8% in November 2021 after 0.9% run-up in October. Twelve month increase rises to 6.9%.

The Consumer Price Index (CPI) increased 0.8% in November after a 0.9% increase in prior month.

That is 2.1% for the last three months, which would be about 8.4% if the increase in the last three months continued for a year.

Graph at top of this post shows the monthly increase in the all-items index along with the core change, which excludes food and energy. Graph also shows an average of the preceding 12 months for the all-items indicator.

The 12 month cumulative change is distressing. The monthly change in all items index and the cumulative change for 12 months looks as follows:

First-time claims for unemployment now below the level when the pandemic started. Ongoing claims for unemployment continuing to decline as of the end of November 2021.

Wow. Am I confused.

The number of people filing first-time claims for unemployment is now at the level before the pandemic started.

For the week ending 12/4/21 there were 184,000 new claims. The four-week average is 219,000 which is almost a match to the average of 212,000 average in January and February 2020.

The number of people drawing unemployment insurance is 1.99 million which shows a continual decline and is approaching the 1.72 million average before the pandemic.

Yet the civilian labor force is still 2 million below the start of the pandemic and the number of people not in the labor force is 5 million higher. Everywhere you look you see help wanted signs and in my tiny corner of the world I have seen restaurants cutting back service or closing in the middle of the workday. Everywhere you look you read about a massive shortage of staff.

Part of the explanation for this confusing picture is common to read about the surprisingly low number of new claims. Speculation in several articles I read is this reflects employers being very hesitant to let go of workers if they think they will be unable to find new staff if needed in the near-term.

For example, consider this report:

One of the reasons why we are seeing record setting high inflation: staggering, astronomical level of federal spending.

Image courtesy of Adobe Stock.

The amount of money Congress has pumped into the economy in an attempt to fight the Covid pandemic is staggering. Don’t quite have enough adjectives to describe the amount of money that is forced into the economy without any corresponding increase in production.

The amount spent directly on the pandemic is more than four times the annual budget at the federal level.

This is one of the primary reasons we are seeing inflation rates running at a thirty year high.

A close cousin on the list of inflation causes is the Fed flooding the economy with liquidity.  See previous discussion: Just how much money has the Federal Reserve created out of thin air and injected into the economy?

I’ve pulled together the amount of money appropriated by Congress in 2020 and 2021 which are focused on fighting the pandemic and stimulating the economy. Here is my tally, with amount of funding in billions of dollars, date Congress passed the legislation, and name of the program:

Brief overview of peer review issues – 11/21.

Image courtesy of Adobe Stock.

To help auditors in the CPA community, the AIPCA peer review staff publishes PR Prompts, a newsletter with information for firms providing audits, review, compilations, and other attestation services.

The newsletter is unbranded and AICPA gives explicit permission to peer reviewers to put their logo and branding information on the newsletter. Those of us who are peer reviewers have specific permission to send it to our clients.

The following comments are provided to you courtesy of the AICPA.  I gratefully acknowledge their work in preparing this info and gladly share it with you. 

For ease of reading, I will not put all the following material in quotations.

Topics in this post:

  • Revenue recognition: 4 top concerns noted by peer reviewers
  • Have you considered reviewer independence implications if additional services are performed for your firm?
  • Do your clients need a single audit?

PR Prompts – Fall 2021:

Revenue recognition: 4 top concerns noted by peer reviewers

To learn where challenges exist for entities and their auditors, the AICPA conducted a survey of peer reviewers, asking them to identify the areas where their firm or their peer review clients have experienced challenges in auditing revenue recognition. Over 230 peer reviewers responded to the survey to share what they’ve seen or experienced relative to the new accounting standard, FASB Accounting Standards Codification (ASC) Topic 606, Revenue From Contracts With Customers. The biggest Topic 606-related challenges were identified as the following:

Brief overview of new accounting rules on the horizon – 11/21.

Image courtesy of Adobe Stock.

To help auditors in the CPA community, the AIPCA peer review staff publishes PR Prompts, a newsletter with information for firms providing audits, review, compilations, and other attestation services.

The newsletter is unbranded and AICPA gives explicit permission to peer reviewers to put their logo and branding information on the newsletter. Those of us who are peer reviewers have specific permission to send it to our clients.

The following comments are provided to you courtesy of the AICPA.  I gratefully acknowledge their work in preparing this info and gladly share it with you. 

For ease of reading, I will not put all the following material in quotations.

One section provides background on new accounting rules that will be effective over the next few years.

PR Prompts – Fall 2021:

Standards with later effective dates to be thinking about

The following ASUs are not effective for NFPs in 2021; however, entities should still be aware of them so they can evaluate and adequately plan for implementation when the time comes.

ASU No. 2020-07, Not-for-Profit Entities (Topic 958): Presentation and Disclosure by Not-for-Profit Entities for Contributed Nonfinancial Assets

While ASU No. 2020-07 is not effective until 2022, NFPs may be considering early adoption. The ASU requires that an NFP (1) present contributed nonfinancial assets as a separate line item in the statement of activities, apart from contributions of cash and other financial assets and (2) disclose the following:

Educational institutions continue to shrink two years into the pandemic.

College classroom. Image courtesy of Adobe Stock.

The double whammy of Covid pandemic and government policies in reaction to the pandemic continue to hammer the educational sector. Unsettling thing is to consider these articles only discuss the current impact and not the long-term destruction of education for all students from pre-K to grad school.

Articles for you to consider:

  • Columbia University settles for a refund of fees their class-action lawsuit claiming refund of fees and tuition.
  • Freshman enrollment in colleges and universities continued to decline in fall 2021. The anticipated return of students who skipped matriculation in fall 2020 has not happened.
  • As an indicator of what is likely happening in all primary and secondary schools across the country, Washington state public schools estimate enrollment for the next two years will be down another 4.5% from their February 2021 estimate.

(Discussion cross-posted from my other blog, Nonprofit Update, because it may be valuable for CPAs performing analytical review procedures during reviews or audits.)

TaxProf – 11/27/21 – Columbia Settles Covid-19 Class Action Tuition Refund Suit For $12.5 Million – Looks like Columbia University got off easy. Students there established a class and were suing for refund of tuition and fees because they were prohibited from in-person classes and instead attended an Ivy League school on their monitor.

Personal Consumption Expenditure for September 2021 shows high inflation rate is continuing.

The Personal Consumption Expenditure (PCE) inflation index increased 0.6% October 2021.  This is a jump from the 0.4% in July, August, and September.  The 0.6% matches the increase in March and April.

The core PCE inflation rate was 0.4% in October which is in the middle of the range from March 2021 through September.

This indicates inflation is continuing and perhaps accelerating.

The cumulative 12 month change, according to BEA, has risen to 5.0% for the 12 months through October 2021, compared to 4.2% for the 12 months ending September.

Brief overview of new accounting rules for 12/31/21 financial statements.

Image courtesy of Adobe Stock.

To help auditors in the CPA community, the AIPCA peer review staff publishes PR Prompts, a newsletter with information for firms providing audits, review, compilations, and other attestation services.

The newsletter is unbranded and AICPA gives explicit permission to peer reviewers to put their logo and branding information on the newsletter. Those of us who are peer reviewers have specific permission to send it to our clients.

The following comments are provided to you courtesy of the AICPA.  I gratefully acknowledge their work in preparing this info and gladly share it with you. 

For ease of reading, I will not put all the following material in quotations.

One section of the newsletter provides background on new accounting rules that will be required in the near term:

PR Prompts – Fall 2021:

Upcoming accounting standards updates (ASUs) not-for-profits (NFPs) should be familiar with at the end of 2021

The following is a summary of FASB ASUs with initial effective dates for most NFPs beginning in calendar-year 2021 and for 2020-2021 fiscal year-ends, or with effective dates that were deferred to 2021. Also, summarized are ASUs on the horizon with effective dates for most NFPs in 2022 and later. Additional information and guidance related to a number of these ASUs can be found in this AICPA article.